Monitoring as Code: Learn more about the Dashboard construct.
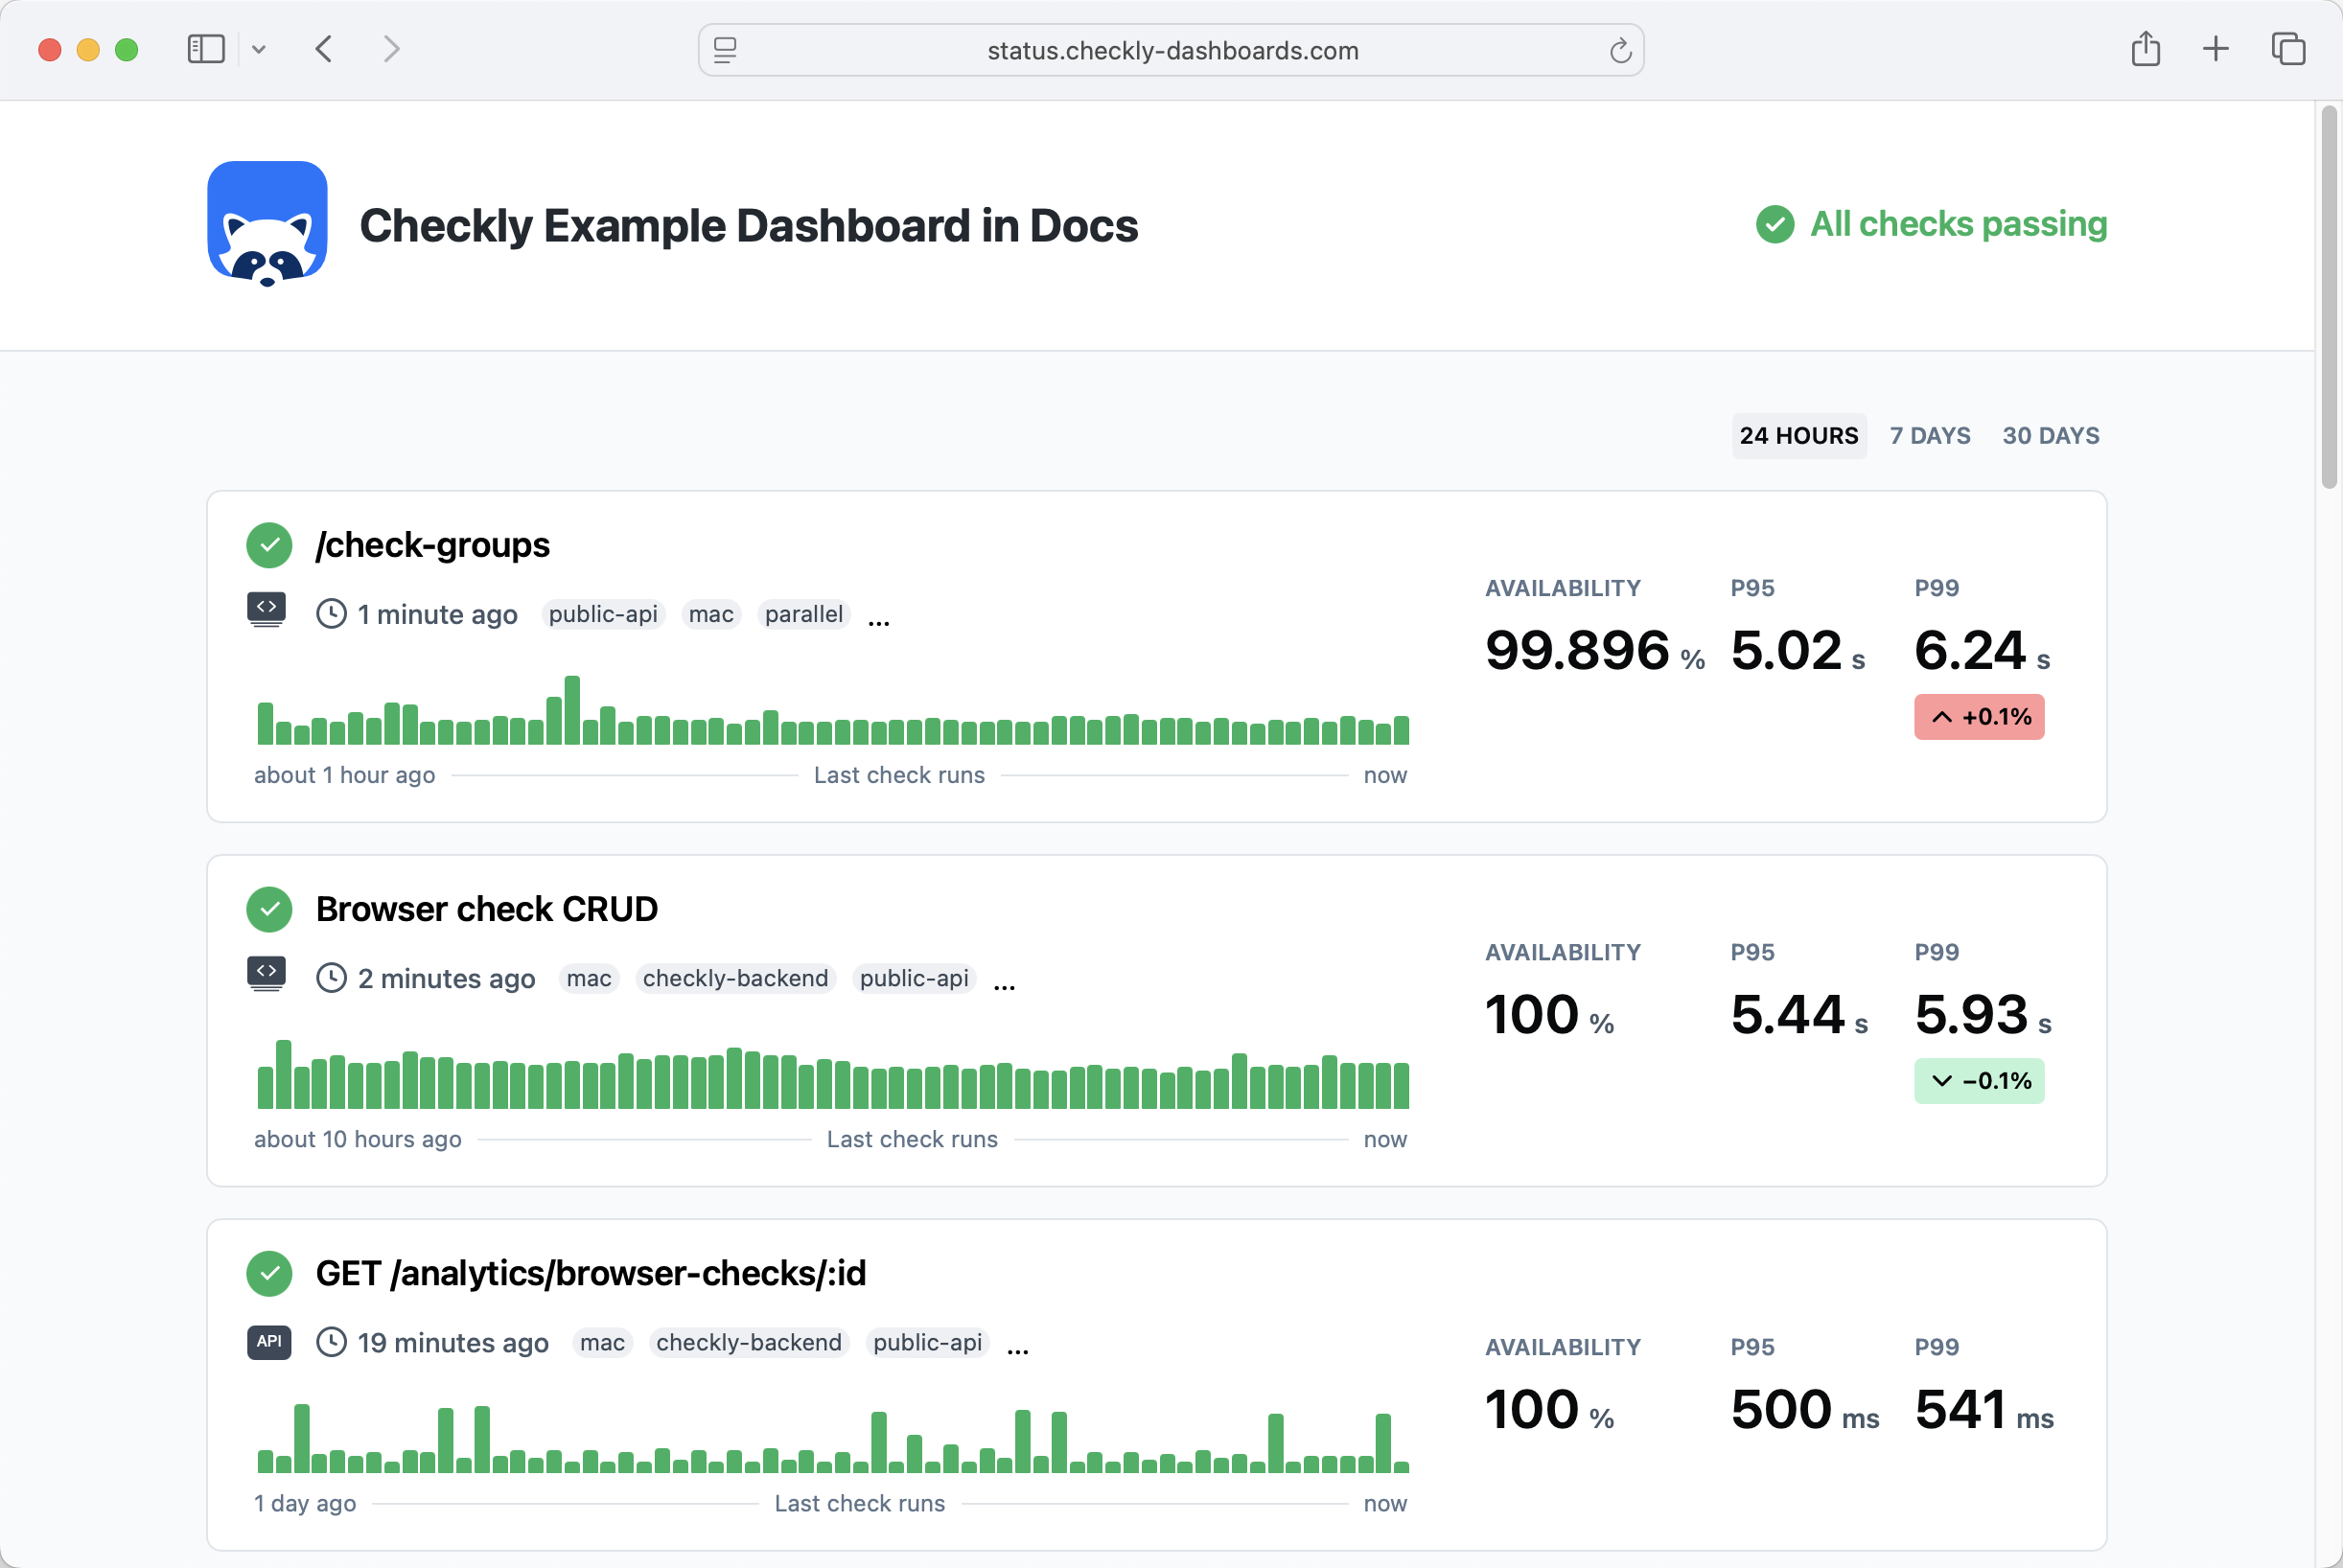
- Show the status of all your checks, or a subset by filtering by
tag. - Show the availability and p95 / p99 response times over the last 24 hours, 7 days and 30 days.
- Communicate custom incident messages and maintenance messages.
Available metrics
Dashboards show the following metrics for each check or monitor:| Metric | Time Period | Description |
|---|---|---|
| Availability | 24h, 7d, 30d | Percentage of successful run results |
| P95 | 24h, 7d, 30d | 95th percentile response time |
| P99 | 24h, 7d, 30d | 99th percentile response time |